 English
 Mandarin
 Bahasa
 Thai
Thai Vietnamese
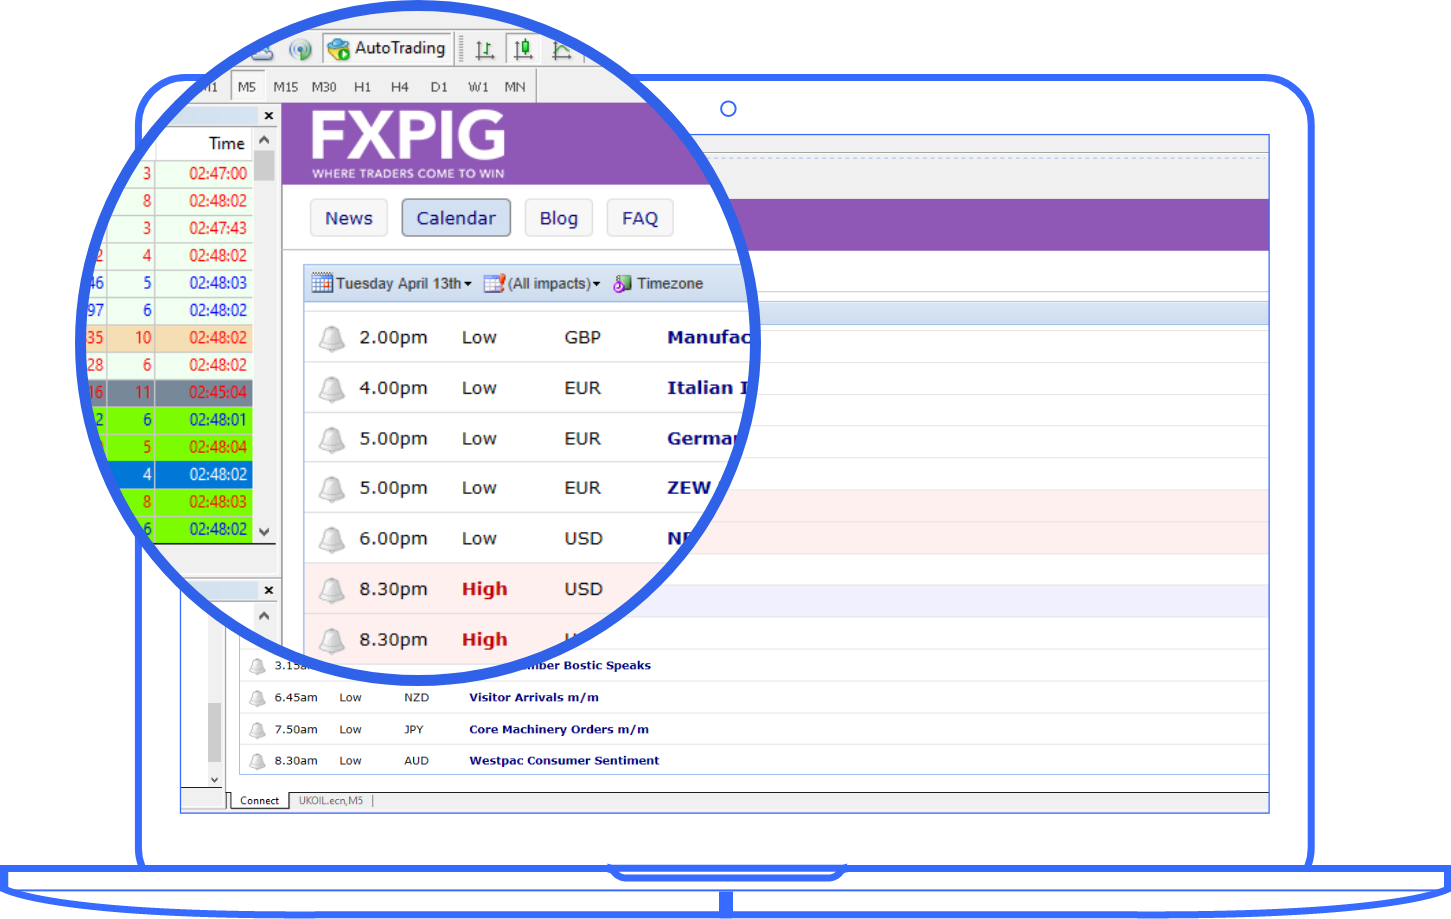
The tool provides future information about macroeconomic events. It is a useful tool to keep track of major economic indicators, news, and alerts when they happen and as they happen.
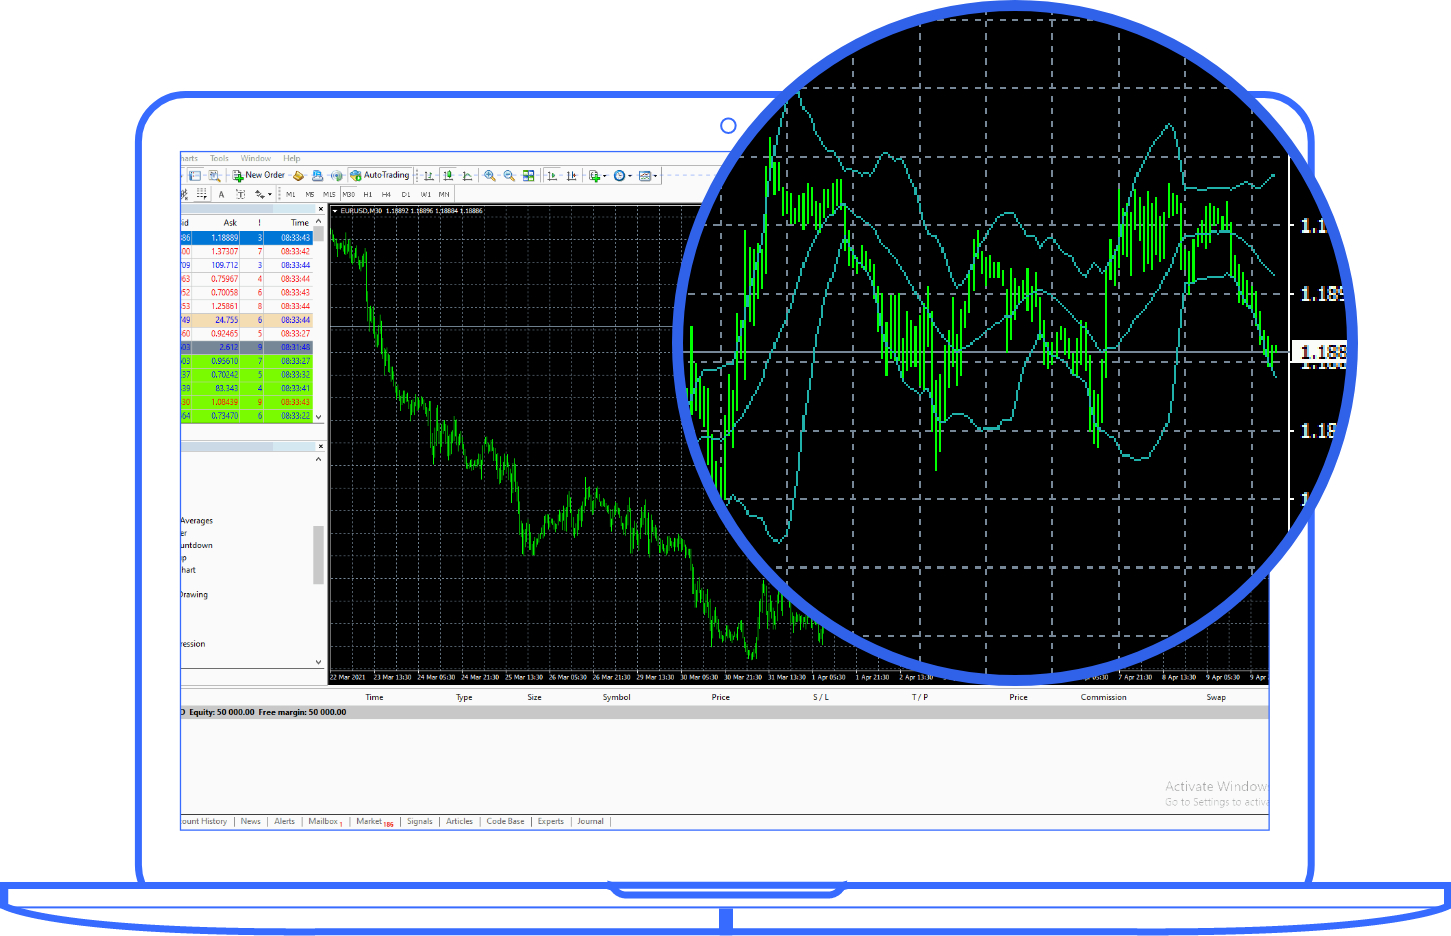
Start trading using popular trading indicators such as Bollinger Bands, Ichimoku Kinko Hyo, MACD, Parabolic SAR, Stochastic Indicator, RSI, and many more.
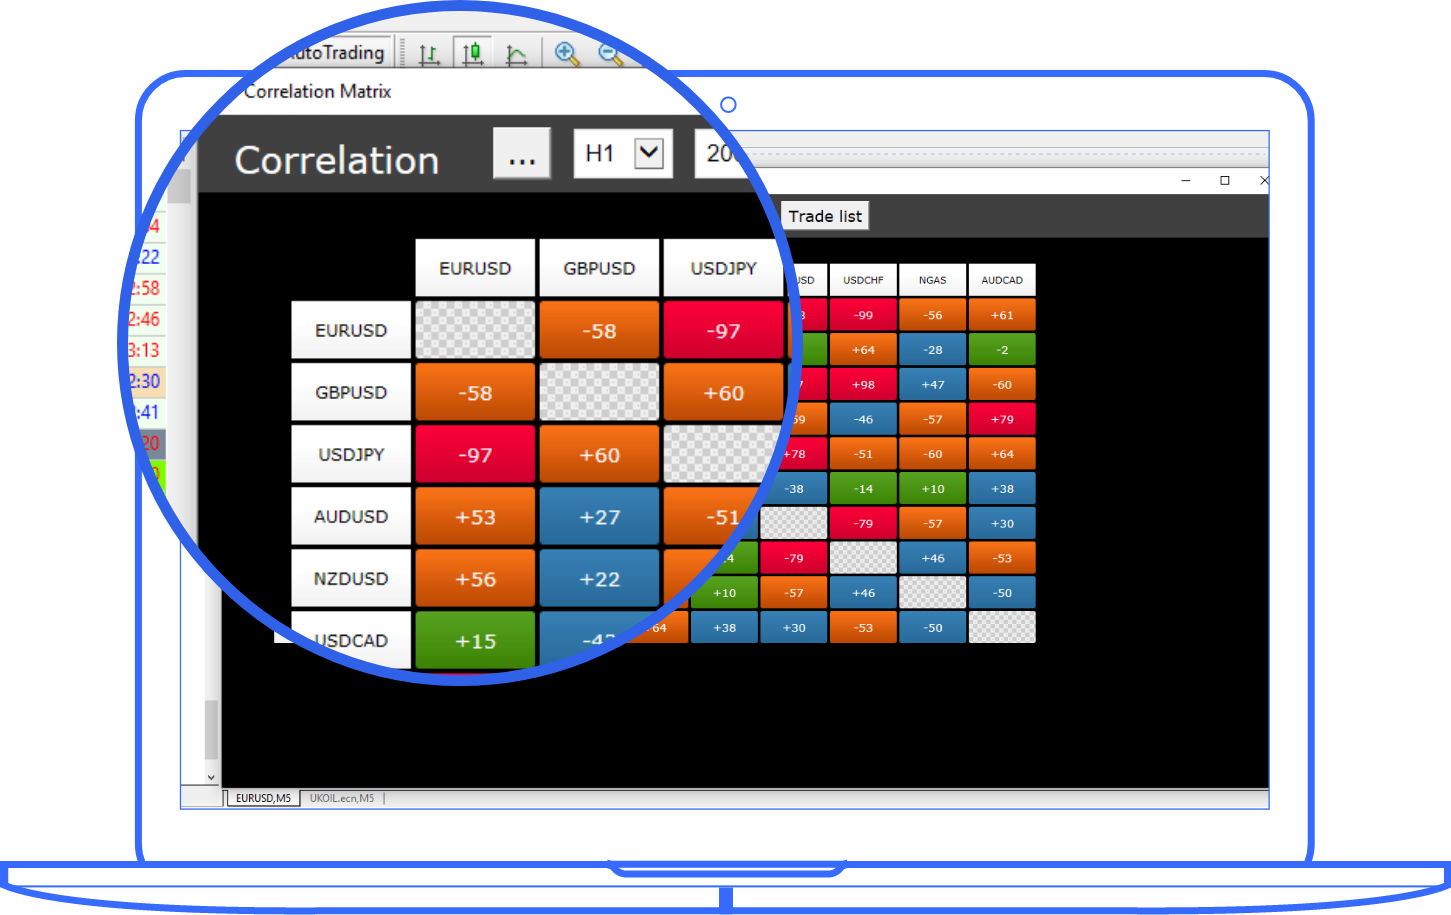
Manage risk by understanding the correlation between different markets and instruments. The positive or negative correlation will help provide greater insights into your overall portfolio.
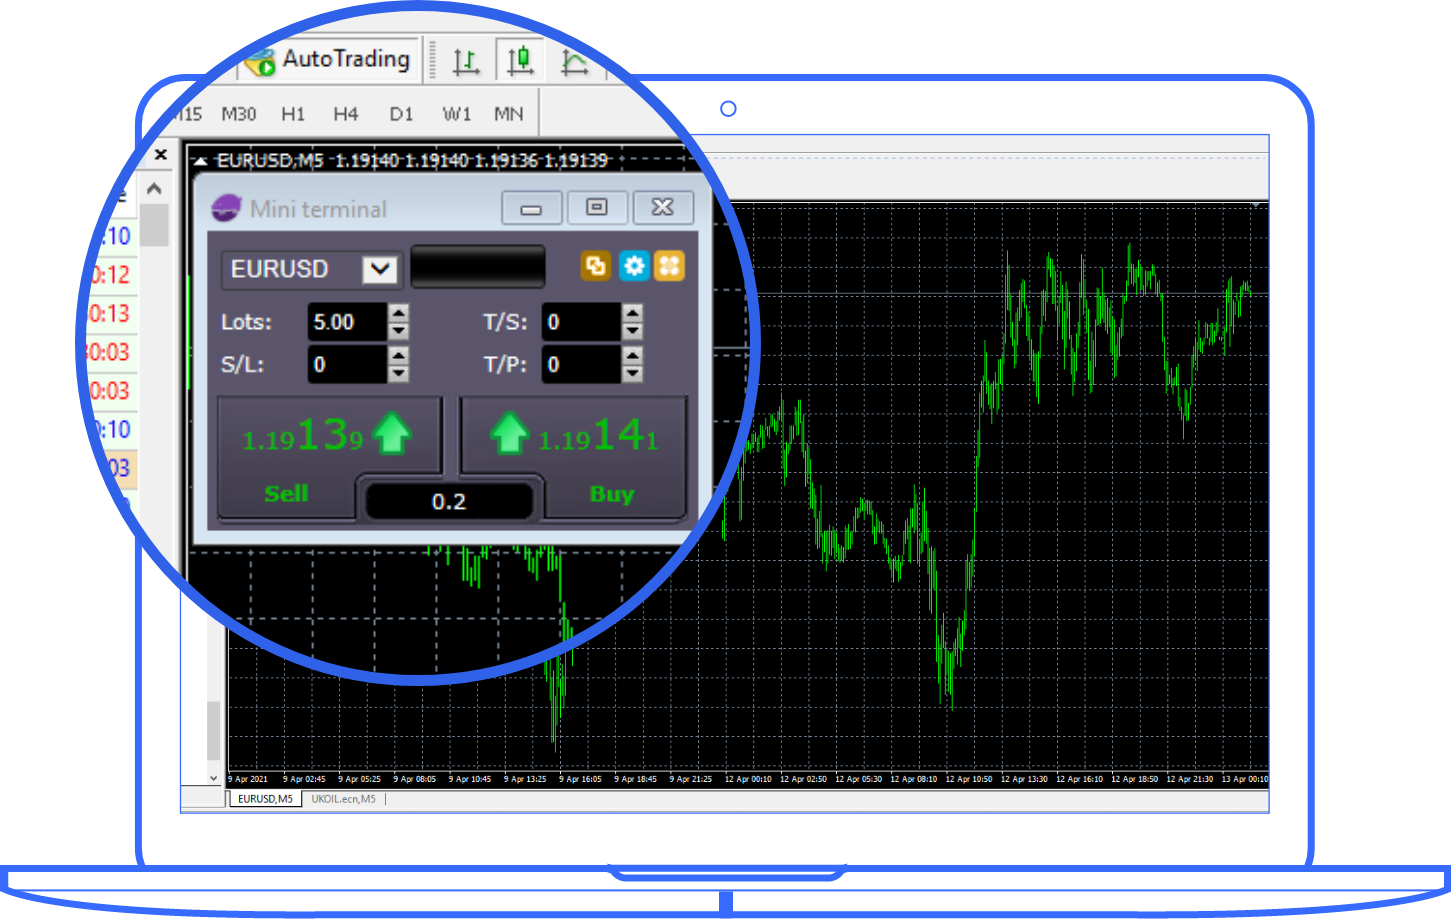
Click Buy or Sell to place a buy or sell order, respectively. Mini Terminal lets you manage risk and position size by adding smart lines to place multiple stops, take profits or issue simple partial close commands.
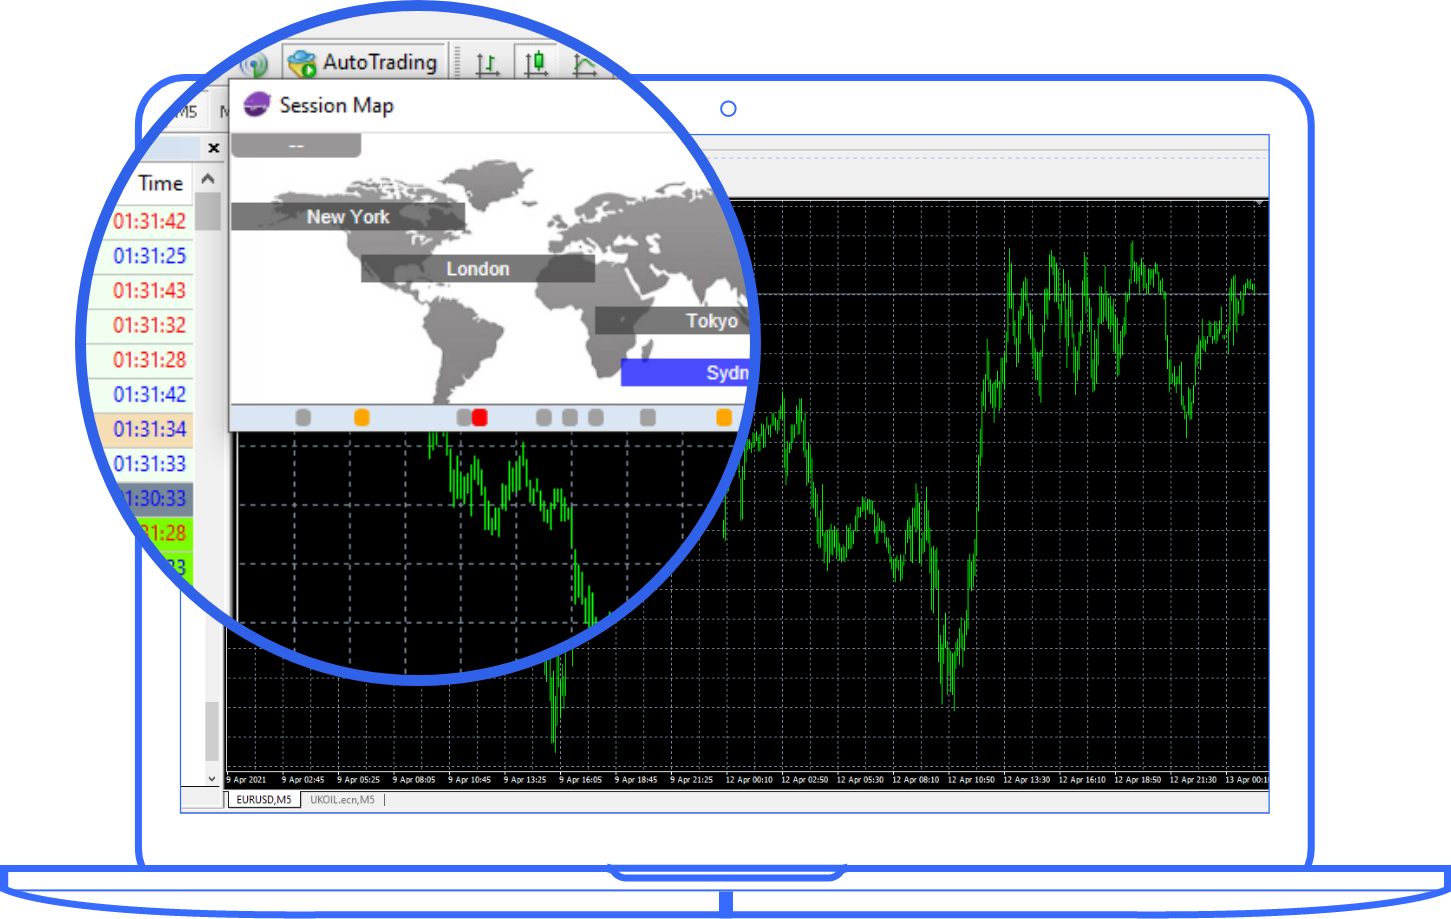
It is a global map that is real-time pending market sessions in local time. You will also be able to see news markers for economic data releases which are color-coded by importance.
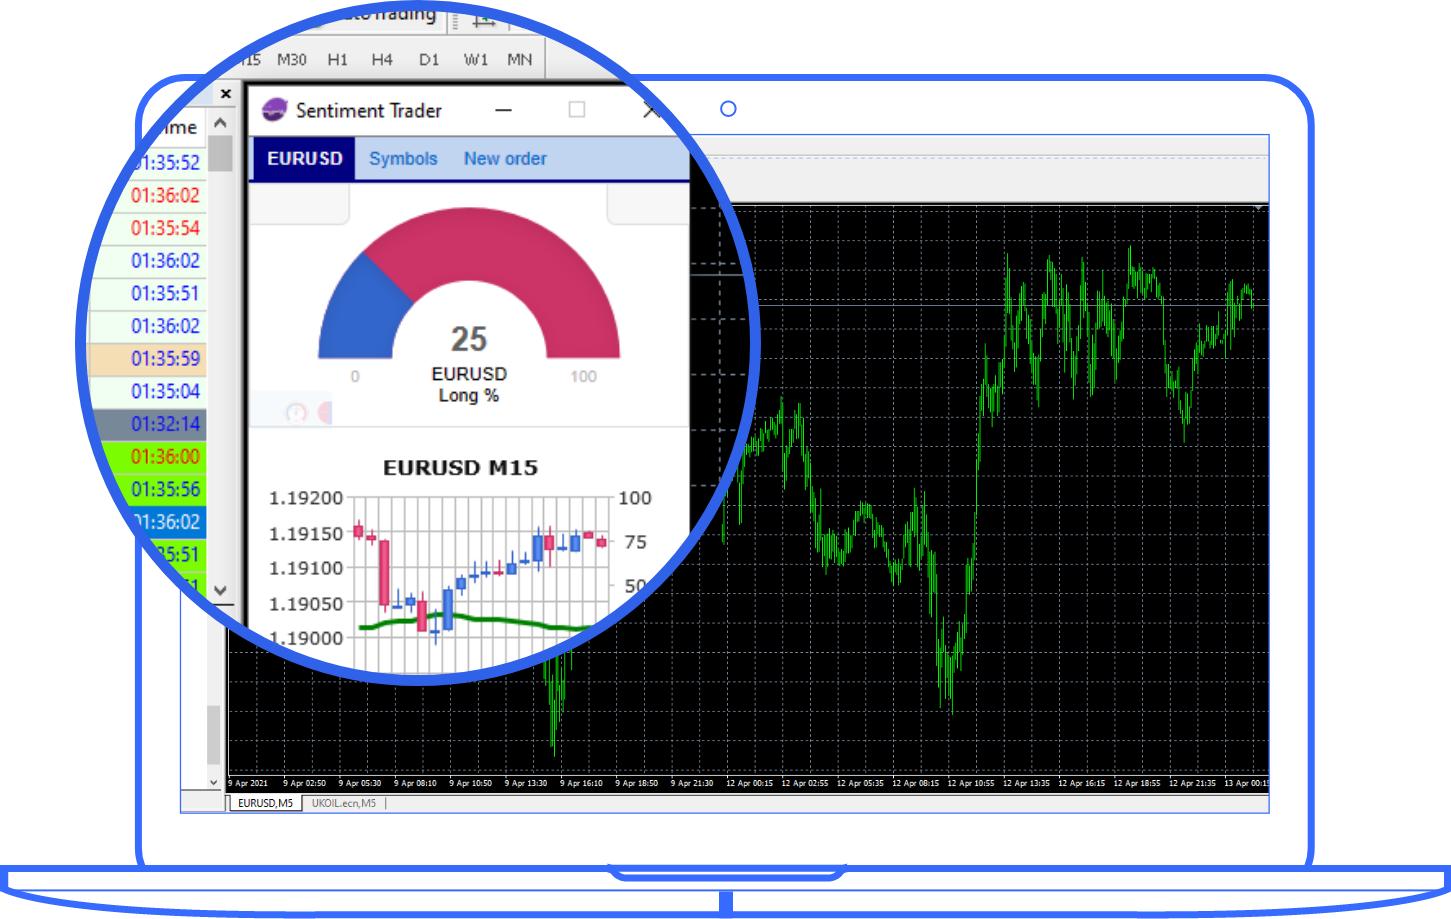
It displays information about live and past data across markets. The sentiment figure is derived based on real-money accounts, in other words, it's the percentage of trades who currently have/had an open buy or sell position.
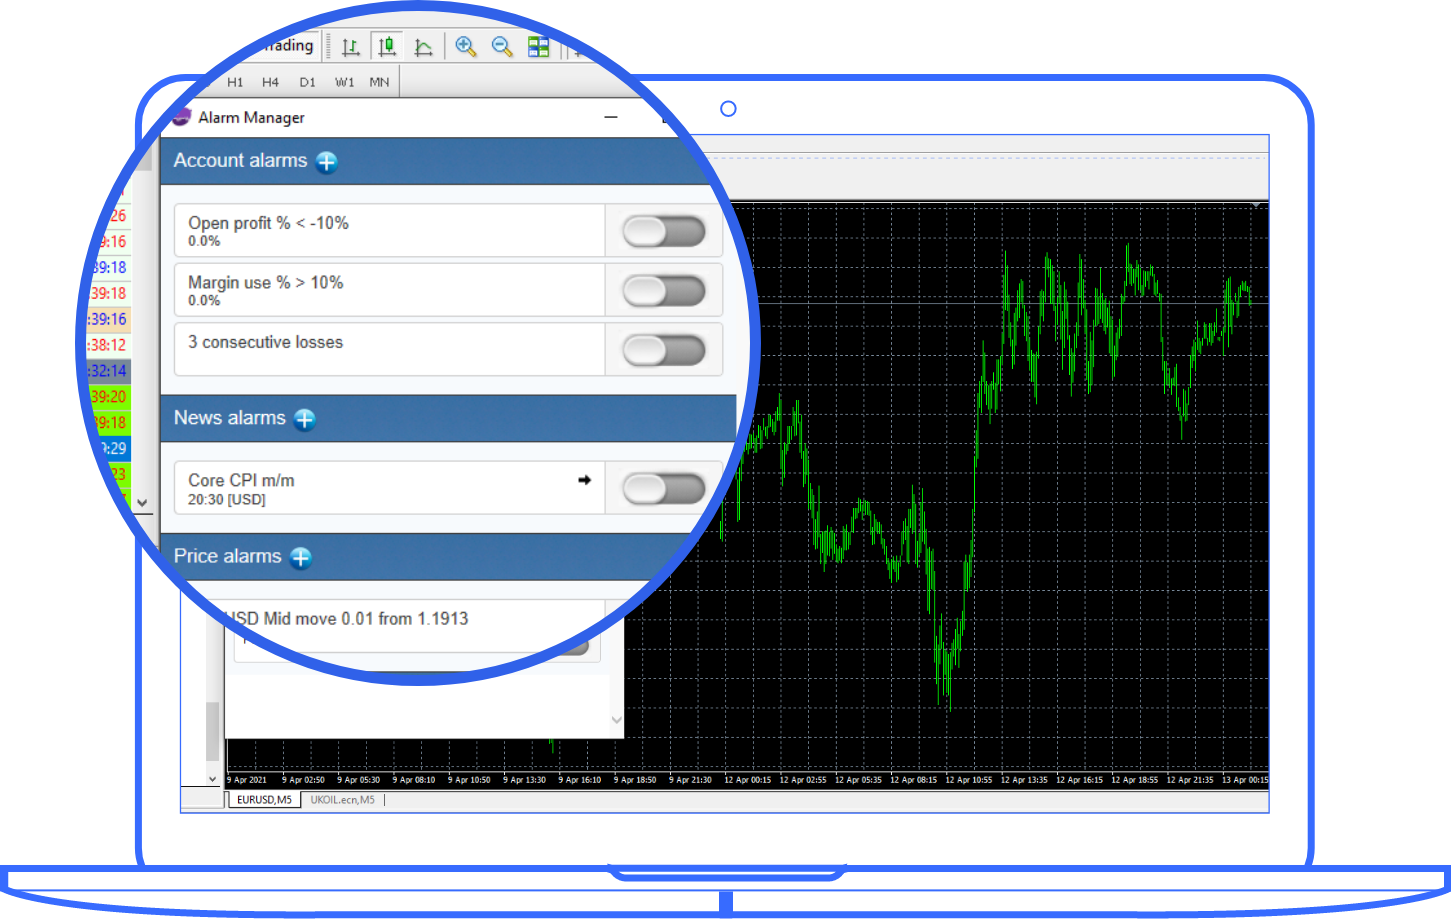
Get notified with released news events, changes in price action, or simply create a personalized alarm manager to get alerts on events such as margin usage, trade entries, and exits, etc.
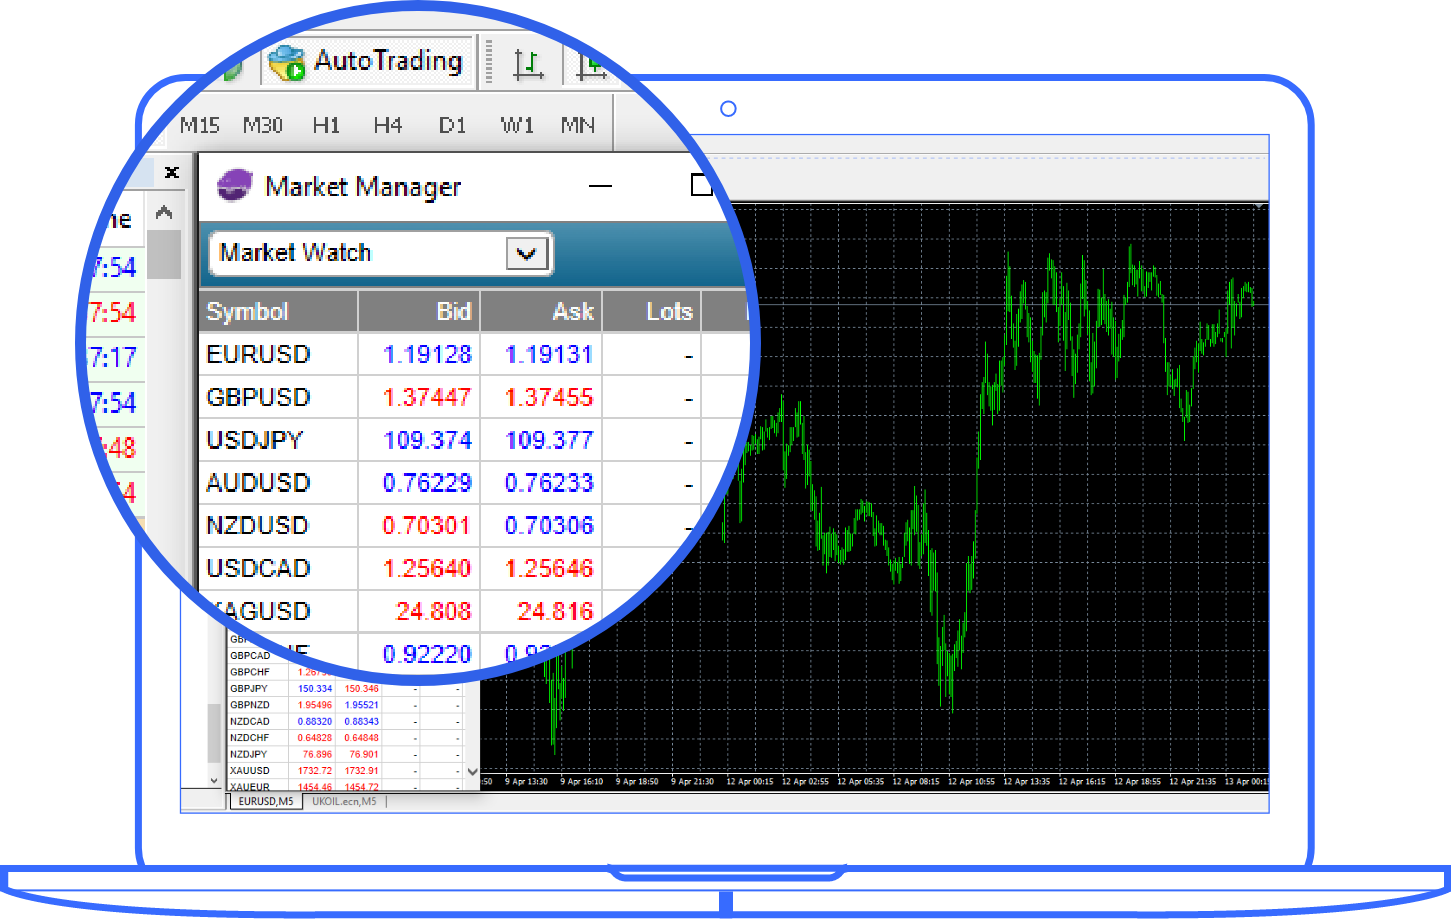
It is a small but convenient window that provides a list of symbol prices, headline information, open tickets, and a concise summary of recent price activity on a symbol.
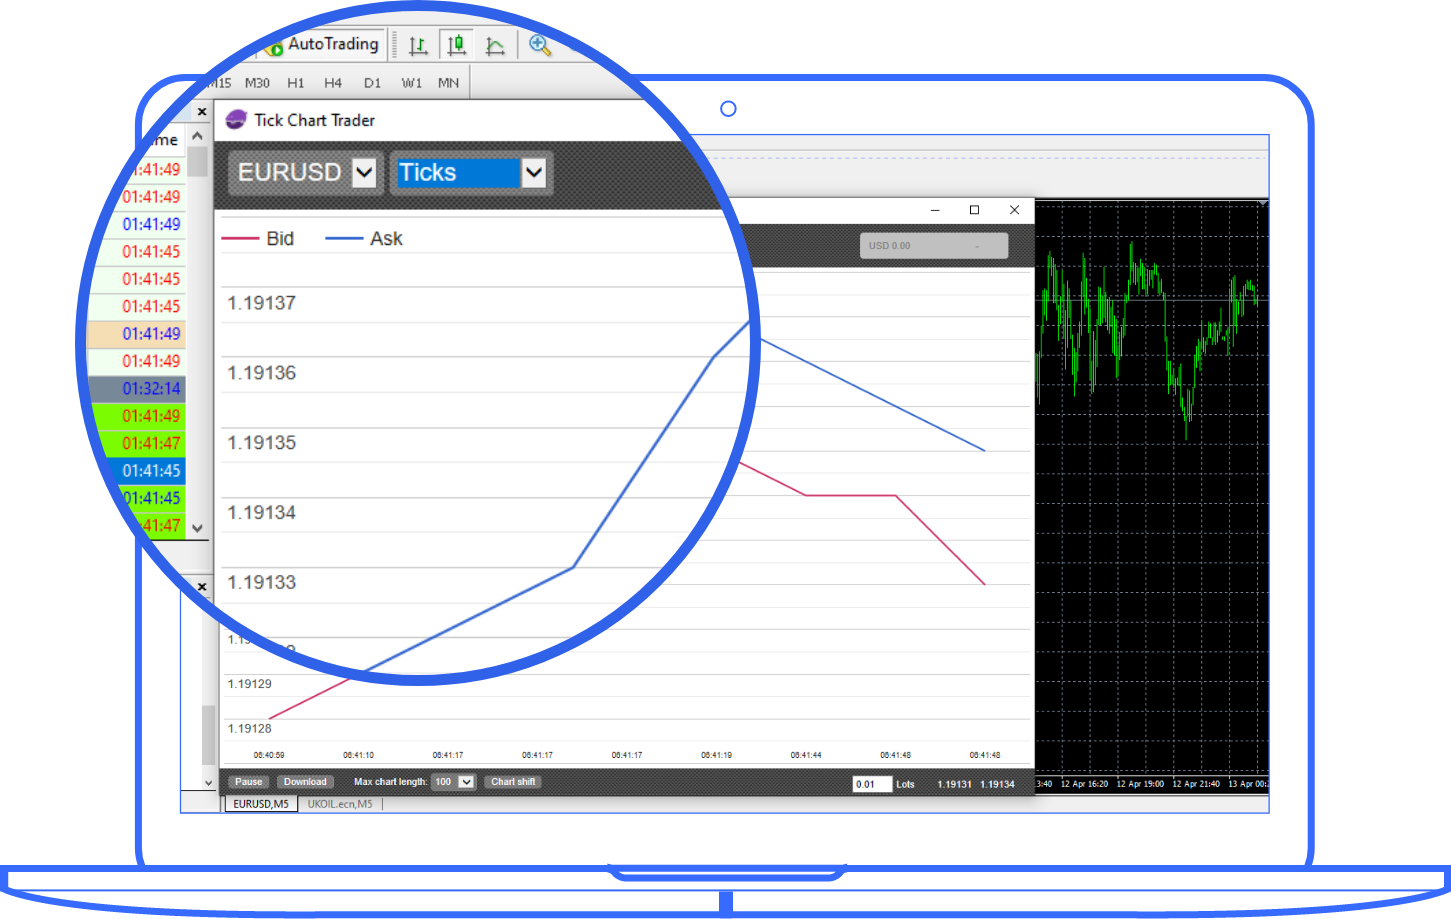
It comes in 5 different styles, namely Tick charts, Tick speed, Timed charts, Tick candles, "Versus" charts which allow quick trading and provides quick entry and exit based on FIFO basis.


